Recent Market Volatility
RECENT MARKET VOLATILITY
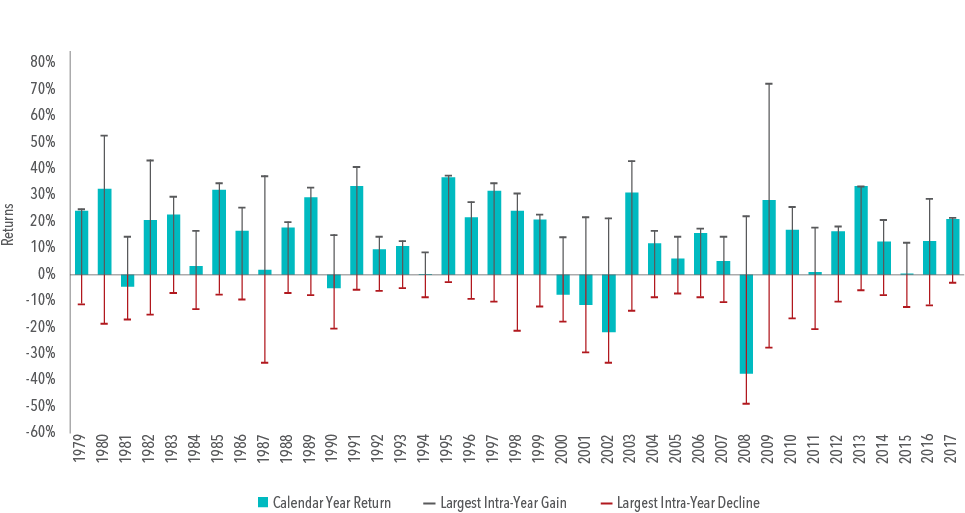
Exhibit 1 shows calendar year returns for the US stock market since 1979, as well as the largest intra-year declines that occurred during a given year. During this period, the average intra-year decline was about 14%. About half of the years observed had declines of more than 10%, and around a third had declines of more than 15%. Despite substantial intra-year drops, calendar year returns were positive in 33 years out of the 39 examined. This goes to show just how common market declines are and how difficult it is to say whether a large intra-year decline will result in negative returns over the entire year.

Exhibit 2 helps illustrate this point. It shows the annualized compound return of the S&P 500 Index going back to 1990 and illustrates the impact of missing out on just a few days of strong returns. The bars represent the hypothetical growth of $1,000 over the period and show what happened if you missed the best single day during the period and what happened if you missed a handful of the best single days. The data shows that being on the sidelines for only a few of the best single days in the market would have resulted in substantially lower returns than the total period had to offer.